INTRODUCTION
1) What
Motivated Data Mining? Why Is It Important?
Data mining can be viewed as a result of the evolution of information
technology. The database system industry has witnessed an evolutionary path in
the development of the following functionalities (shown in below Figure): data
collection and database creation, data management (including data storage
and retrieval, and database transaction processing), and advanced data
analysis (involving data warehousing and data mining). For instance, the
early development of data collection and database creation mechanisms served as
a prerequisite for later development of effective mechanisms for data storage
and retrieval, and query and transaction processing.
FIG:
Evolution of database system technology
In 1960s, database and information technology has been evolving from
primitive file processing systems to sophisticated and powerful database
systems. The research and development in database systems since the 1970s has
progressed from early hierarchical and network database systems to the
development of relational database systems, data modeling tools, and indexing
and accessing methods. Efficient methods for on-line transaction processing (OLTP), where a query is viewed as a
read-only transaction, have contributed to the evolution of relational
technology as a major tool for efficient storage, retrieval, and management of
large amounts of data.
Database technology since the mid-1980s has been characterized by the
popular adoption of relational technology and an increase of research and
development activities on new and powerful database systems. These promote the
development of advanced data models such as extended- relational,
object-oriented, object-relational, and deductive models. Application-oriented
database systems, including spatial, temporal, multimedia, active, stream, and
sensor, and scientific and engineering databases, knowledge bases, and office
information bases have grown.
Data can now be stored in many different kinds of databases and
information repositories. One data repository architecture that has emerged is
the data warehouse, a repository of multiple heterogeneous data sources
organized under a unified schema at a single site in order to facilitate
management decision making. Data warehouse technology includes data cleaning,
data integration, and on-line analytical
processing (OLAP).
The abundance of data, coupled with the need for powerful data
analysis tools, has been described as a data rich but information poor
situation. The fast-growing, tremendous amount of data, collected and stored in
large and numerous data repositories, has far exceeded our human ability for
comprehension without powerful tools. As a result, data collected in large data
repositories become “data tombs”—data archives that are infrequently visited.
Consequently, important decisions are often made based not on the
information-rich data stored in data repositories, but rather on a decision
maker’s intuition, simply because the decision maker does not have the tools to
extract the valuable knowledge embedded in the vast amounts of data. Data
mining tools perform data analysis and may uncover important data patterns,
contributing greatly to business strategies, knowledge bases, and scientific
and medical research. The widening gap between data and information calls for a
systematic development of data mining tools that will turn data tombs into
“golden nuggets” of knowledge.
2)
What Is Data Mining?
Data mining
refers to extracting or “mining” knowledge from large amounts of data. the
mining of gold from rocks or sand is referred to as gold mining rather than
rock or sand mining. Thus, data mining should have been more appropriately named
“knowledge mining from data”. “Knowledge mining,” a shorter term, may not
reflect the emphasis on mining from large amounts of data.
Another synonym for
data mining is Knowledge Discovery from Data, or KDD. data mining as simply an
essential step in the process of knowledge discovery. Knowledge discovery as a
process is depicted in below Figure and consists of an iterative sequence of
the following steps:
1. Data
cleaning (to remove noise
and inconsistent data)
2. Data
integration (where multiple
data sources may be combined)
3. Data selection (where data relevant to the analysis
task are retrieved from the database)
4. Data
transformation (where
data are transformed or consolidated into forms appropriate for mining by performing summary or aggregation operations,
for instance)
5. Data mining (an essential process where intelligent
methods are applied in order to extract data patterns)
6. Pattern
evaluation (to identify the
truly interesting patterns representing knowledge based on some
interestingness measures)
7. Knowledge
presentation (where
visualization and knowledge representation techniques are used to present the
mined knowledge to the user)
Steps 1 to 4 are different forms of data preprocessing, where the data
are prepared for mining. The data mining step may interact with the user or a
knowledge base. The interesting patterns are presented to the user and may be
stored as new knowledge in the knowledge base. Data mining is a step in the
knowledge discovery process. Data mining is the process of discovering
interesting knowledge from large amounts of data stored in databases, data
warehouses, or other information repositories.
The architecture of a typical data mining system may have the following
major components (as shown in below figure):
Fig:
Architecture of typical data mining system
·
Database, data warehouse, World Wide Web,
or other information repository: This is one or a set of databases, data warehouses, spreadsheets, or
other kinds of information repositories. Data cleaning and data integration
techniques may be performed on the data.
·
Database or data warehouse server: The database or data warehouse server is
responsible for fetching the relevant data, based on the user’s data mining
request.
·
Knowledge base: This is the domain knowledge that is
used to guide the search or evaluate the interestingness of resulting patterns.
Such knowledge can include concept hierarchies, used to organize attributes or
attribute values into different levels of abstraction.
·
Data mining engine: This is essential to the data mining
system and ideally consists of a set of functional modules for tasks such as
characterization, association and correlation analysis, classification,
prediction, cluster analysis, outlier analysis, and evolution analysis.
·
Pattern evaluation module: This component typically employs
interestingness measures and interacts with the data mining modules so as to focus
the search toward interesting patterns.
·
User interface: This module communicates between users
and the data mining system, allowing the user to interact with the system by
specifying a data mining query.
3)
Data
Mining—On What Kind of Data?
Data mining can be performed on a number of
different data repositories.
i)
Relational Databases
ii)
Data Warehouses
iii)
Transactional Databases
iv)
Advanced data and information systems
i) Relational Databases: A database system, also called a database management system (DBMS),
consists of a collection of interrelated data, known as a database, and a set
of software programs to manage and access the data.
A relational database is a collection of tables, each of which is
assigned a unique name. Each table consists of a set of attributes (columns or
fields) and usually stores a large set of tuples (records or rows).
Each tuple in a relational table represents an object identified by a unique key
and described by a set of attribute values. A semantic data model, such as
an entity-relationship (ER) data model, is often constructed for relational
databases. An ER data model represents the database as a set of entities and
their relationships.
Consider the following example.
Example:
A relational
database for AllElectronics. The AllElectronics Company is
described by the following relation tables: customer, item, employee,
and branch. Fragments of the tables described here are shown in Figure:
·
The
relation customer consists of a set of attributes, including a unique
customer identity number (cust_ID), customer name, address, age,
occupation, annual income, credit information, category, and so on.
·
Similarly,
each of the relations item, employee, and branch consists
of a set of attributes describing their properties.
·
Tables can
also be used to represent the relationships between or among multiple relation
tables. For our example, these include purchases (customer purchases
items, creating a sales transaction that
is handled by an employee), items sold (lists the items sold in a given
transaction), and works at (employee works at a branch of AllElectronics).
Relational data can be accessed by database queries written in a
relational query language. A query allows retrieval of specified subsets of the
data. Suppose that your job is to analyze the AllElectronics data.
Through the use of relational queries, you can ask things like “Show me a list
of all items that were sold in the last quarter.”
When data mining is applied to relational databases, we can go further
by searching for trends or data patterns. For example, data mining
systems can analyze customer data to predict the credit risk of new customers
based on their income, age, and previous credit information.
Fig:
Fragments of relations from a relational
database for AllElectronics.
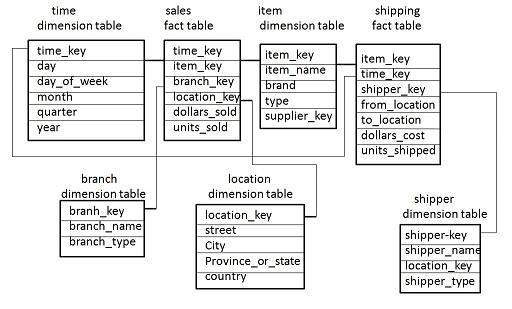
ii) Data Warehouses: A data warehouse is a repository of
information collected from multiple sources, stored under a unified schema, and
that usually resides at a single site. Data warehouses are constructed via a
process of data cleaning, data integration, data transformation, data loading,
and periodic data refreshing. The typical framework for construction and use of
a data warehouse for AllElectronics is as shown below:
Fig: Data
warehouse for AllElectronics
A data warehouse is usually modeled by a multidimensional database
structure, where each dimension corresponds to an attribute or a set of
attributes in the schema, and each cell stores the value of some aggregate
measure, such as count or sales amount. The actual physical
structure of a data warehouse may be a relational data store or a multidimensional
data cube. A data cube provides a multidimensional view of data and allows the
precomputation and fast accessing of summarized data.
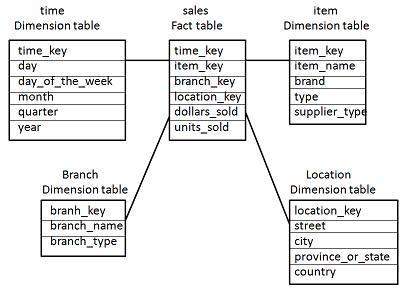
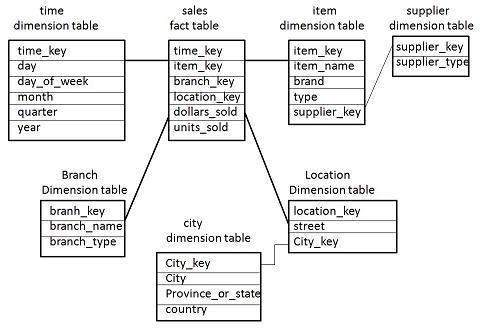
Example: A data cube for AllElectronics. A data cube for summarized
sales data of AllElectronics
is
presented in below Figure(a). The cube has three dimensions: address (with
city values Chicago, New York, Toronto, Vancouver), time (with
quarter values Q1, Q2, Q3, Q4), and item(with item type values home
entertainment, computer, phone, security). The aggregate value stored in
each cell of the cube is sales amount (in thousands). For example, the
total sales for the first quarter, Q1, for items relating to security systems
in Vancouver is$400,000, as stored in cell (Vancouver, Q1, security).
By
providing multidimensional data views and the precomputation of summarized data,
data warehouse systems are well suited for on-line analytical processing, or OLAP.
Examples of OLAP operations include drill-down and roll-up, which allow the
user to view the data at differing degrees of summarization, as illustrated in
below Figure(b).
Fig: A
Multidimensional data cube
iii) Transactional Databases: Transactional database consists of a file
where each record represents a transaction. A transaction typically includes a
unique transaction identity number (trans_ID) and a list of the items making up
the transaction (such as items purchased in a store).The transactional database
may have additional tables associated with it, which contain other information
regarding the sale, such as the date of the transaction, the customer ID number,
the ID number of the salesperson and of the branch at which the sale occurred, and
so on.
Fig:
Transactional Database for sales at AllElectronics
iv)Advanced Data and Information systems:
a)
Object-Relational Databases: The object-relational data model inherits
the essential
concepts of
object-oriented databases, where, in general terms, each entity is considered
as an object. Each object has associated with it the following:
·
A set of variables that describe the objects.
These correspond to attributes in the entity-relationship and relational
models.
·
A set of messages that the object can use to
communicate with other objects, or with the rest of the database system.
·
A set of methods, where each method holds the
code to implement a message. Upon receiving a message, the method returns a
value in response. For instance, the method for the message get_photo(employee)
will retrieve and return a photo of the given employee object.
Objects
that share a common set of properties can be grouped into an object class. Each
object is an instance of its class. Object classes can be organized into
class/subclass hierarchies so that each class represents properties that are
common to objects in that class.
b)
Temporal Databases, Sequence Databases,
and Time-Series Databases: A temporal database typically stores
relational data that include time-related attributes. These attributes may
involve several timestamps, each having different semantics. A sequence database stores sequences of
ordered events, with or without a concrete notion of time. Examples include
customer shopping sequences, Web click streams, and biological sequences. A time-series database stores sequences
of values or events obtained over repeated measurements of time (e.g., hourly,
daily, weekly). Examples include data collected from the stock exchange,
inventory control, and the observation of natural phenomena (like temperature
and wind).
c)
Spatial Databases and Spatiotemporal
Databases: Spatial databases contain spatial-related information. Examples include geographic
(map) databases, very large-scale integration (VLSI) or computer-aided design
databases, and medical and satellite image databases. Spatial data may be
represented in raster format, consisting of n-dimensional bit maps or
pixel maps. For example, a 2-D satellite image may be represented as raster
data, where each pixel registers the rainfall in a given area. Maps can be
represented in vector format, where roads, bridges, buildings, and lakes are
represented.
A spatial database that stores spatial
objects that change with time is called a spatiotemporal database, from which
interesting information can be mined. For example, we may be able to group the
trends of moving objects and identify some strangely moving vehicles, or
distinguish a bioterrorist attack from a normal outbreak of the flu based on
the geographic spread of a disease with time.
d)
Text Databases and Multimedia Databases: Text
databases are databases that
contain word descriptions for objects. These word descriptions are usually not
simple keywords but rather long sentences or paragraphs, such as product specifications,
error or bug reports, warning messages, summary reports, notes, or other
documents.
Multimedia
databases store image, audio, and video data. They are used in applications
such as picture content-based retrieval, voice-mail systems, video-on-demand systems,
the World Wide Web, and speech-based user interfaces that recognize spoken commands
e)
Heterogeneous Databases and Legacy
Databases: A heterogeneous database consists of a
set of interconnected, autonomous component databases. The components communicate
in order to exchange information and answer queries. Objects in one component
database may differ greatly from objects in other component databases, making
it difficult to assimilate their semantics into the overall heterogeneous
database.
A legacy database is a
group of heterogeneous databases that combines different kinds of data
systems, such as relational or object-oriented databases, hierarchical
databases, network databases, spreadsheets, multimedia databases, or file
systems.
f)
Data Streams: Many applications involve the generation
and analysis of a new kind of data, called stream
data, where data flow in and out of an observation platform (or window)
dynamically. Such data streams have the following unique features: huge or possibly infinite volume,
dynamically changing, flowing in and out in a fixed order, allowing only one or
a small number of scans, and demanding fast (often real-time) response time.
Typical examples of data streams include various kinds of scientific and engineering
data.
g)
The World Wide Web: The World Wide Web where data objects are
linked together to facilitate interactive access. Users seeking information of
interest traverse from one object via links to another. Such systems provide
ample opportunities and challenges for data mining.
4)Data Mining Functionalities—What Kinds
of Patterns Can Be Mined?
Data mining functionalities are used to
specify the kind of patterns to be found in data mining tasks. Data mining
tasks can be classified into two categories: descriptive and predictive.
·
Descriptive
mining tasks characterize the general properties of the data in the database.
·
Predictive
mining tasks perform inference on the current data in order to make
predictions.
Data mining functionalities, and the kinds of patterns they can
discover, are described below.
i.
Concept/Class
Description: Characterization and Discrimination:
Data can be
associated with classes or concepts. For example, in the AllElectronics store, classes of
items for sale include computers and
printers, and concepts of
customers include bigSpenders and
budgetSpenders. It can be
useful to describe individual classes and concepts in summarized, concise, and
yet precise terms. Such descriptions of a class or a concept are called
class/concept descriptions.
These
descriptions can be derived as:
(1) data
characterization, by summarizing the data of the class under study (often
called the target class) in general terms.
(2) data
discrimination, by comparison of the target class with one or a set of
comparative classes (often called the contrasting classes).
(3) both
data characterization and discrimination.
Data
characterization is a summarization of the general characteristics or
features of a target class of data. For example, to study the characteristics
of software products whose sales increased by 10% in the last year.
The output of data characterization
can be presented in various forms. Examples include pie charts, bar charts,
curves, multidimensional data cubes, and multidimensional tables, including
crosstabs.
Data discrimination is a comparison of the general features
of target class data objects with the general features of objects from one or a
set of contrasting classes. The target and contrasting classes can be specified
by the user, and the corresponding data objects retrieved through database
queries. For example, the user may like to compare the general features of
software products whose sales increased by 10% in the last year with those
whose sales decreased by at least 30% during the same period.
The forms of output presentation are similar to those for
characteristic descriptions.
ii.
Mining
Frequent Patterns, Associations, and Correlations:
Frequent patterns, as the name suggests,
are patterns that occur frequently in data. There are many kinds of frequent
patterns, including item sets, subsequences, and substructures. A frequent
item set typically refers to a set of items that frequently appear together
in a transactional data set, such as milk and bread. A frequently occurring
subsequence, such as the pattern that customers tend to purchase first a PC,
followed by a digital camera, and then a memory card, is a (frequent) sequential
pattern. A substructure can refer to different structural forms, such as
graphs, trees, or lattices, which may be combined with item sets or subsequences.
If a substructure occurs frequently, it is called a (frequent) structured
pattern. Mining frequent patterns leads to the discovery of interesting
associations and correlations within data.
Example: Association analysis. Suppose, as a
marketing manager of AllElectronics, to determine which items are frequently
purchased together within the same transactions. An example of such a rule,
mined from the AllElectronics transactional database, is
buys(X,
“computer”) => buys(X, “software”) [support = 1%; confidence = 50%]
where X is a variable representing a customer. A confidence, or
certainty, of 50% means that if a customer buys a computer, there is a 50%
chance that she will buy software as well. A 1% support means that 1% of all of
the transactions under analysis showed that computer and software were
purchased together. This association rule involves a single attribute or
predicate (i.e., buys) that repeats. Association rules that contain a
single predicate are referred to as single-dimensional association rules.
Dropping the predicate notation, the above rule can be written simply as “computer)software
[1%, 50%]”.
A data mining system may find association rules like
age(X,
“20:::29”)^income(X, “20K:::29K”) => buys(X, “CD player”)
[support
= 2%, confidence = 60%]
Adopting
the terminology used in multidimensional databases, where each attribute is
referred to as a dimension, the above rule can be referred to as a
multidimensional association rule.
iii.
Classification
and Prediction:
Classification is the process of finding
a model (or function) that describes and distinguishes data classes or
concepts, for the purpose of being able to use the model to predict the class
of objects whose class label is unknown. The derived model is based on the
analysis of a set of training data.
The derived model may be represented in various forms, such as
classification (IF-THEN) rules, decision trees, mathematical formulae, or
neural networks (as shown in below Figure). A decision tree is a
flow-chart-like tree structure, where each node denotes a test on an attribute
value, each branch represents an outcome of the test, and tree leaves represent
classes or class distributions. Decision trees can easily be converted to
classification rules. A neural network, when used for classification, is
typically a collection of neuron-like processing units with weighted
connections between the units.
Fig: A
classification model can be represented in various forms, such as (a) IF-THEN
rules,
(b) a decision tree, or a (c) neural
network.
iv.
Cluster
Analysis:
Clustering analyzes data objects without consulting a known class
label. The objects are clustered or grouped based on the principle of maximizing
the intraclass similarity and minimizing the interclass similarity. That
is, clusters of objects are formed so that objects within a cluster have high
similarity in comparison to one another, but are very dissimilar to objects in
other clusters. Each cluster that is formed can be viewed as a class of
objects, from which rules can be derived.
Example: Cluster
analysis. Cluster analysis
can be performed on AllElectronics customer data in order to identify
homogeneous subpopulations of customers. These clusters may represent
individual target groups for marketing. Figure below shows a 2-D plot of
customers with respect to customer locations in a city. Three clusters of data
points are evident.
Fig: A 2-D plot
of customer data with respect to customer locations in a city, showing three
data
clusters. Each cluster “center” is marked
with a “+”.
v.
Outlier
Analysis
A database may contain data objects that do not comply with the
general behavior or model of the data. These data objects are outliers. Most
data mining methods discard outliers as noise or exceptions. However, in some
applications such as fraud detection, the rare events can be more interesting
than the more regularly occurring ones. The analysis of outlier data is
referred to as outlier mining.
Example: Outlier analysis. Outlier analysis may uncover fraudulent
usage of credit cards by detecting purchases of extremely large amounts for a
given account number in comparison to regular charges incurred by the same
account. Outlier values may also be detected with respect to the location and
type of purchase, or the purchase frequency.
vi.
Evolution
Analysis:
Data evolution analysis describes and
models regularities or trends for objects whose behavior changes over time.
Example: Evolution
analysis. A data mining
study of stock exchange data may identify stock evolution regularities for
overall stocks and for the stocks of particular companies. Such regularities
may help predict future trends in stock market prices, contributing to your
decision making regarding stock investments.
5)Are All
of the Patterns Interesting?
“Are all of
the patterns interesting?” This raises
some serious questions for data mining. You may wonder, “What makes a pattern interesting? Can a data mining system generate
all of the interesting patterns? Can a data mining system generate only
interesting patterns?”
To answer the first question, a pattern is interesting if it is (1) easily
understood by humans, (2) valid on new or test data with some degree
of certainty, (3) potentially useful, and (4) novel. A
pattern is also interesting if it validates a hypothesis that the user sought
to confirm. An interesting pattern represents knowledge.
Several objective measures of pattern
interestingness exist. An objective measure for association rules of the form X
=> Y is rule support, representing the percentage of transactions
from a transaction database that the given rule satisfies. This is taken to be the
probability P(X U Y),where X U Y indicates
that a transaction contains both X and Y, that is, the union of
itemsets X and Y. Another objective measure for association rules
is confidence, which assesses the degree of certainty of the detected
association. This is taken to be the conditional probability P(Y/X),
that is, the probability that a transaction containing X also contains Y.
Support and confidence are defined as
support(X
=> Y) = P(X U Y)
confidence(X => Y) = P(Y/X)
Subjective interestingness measures are based on user beliefs in the data.
These measures find patterns interesting if they are unexpected (contradicting
a user’s belief) or offer strategic information on which the user can act. In
the latter case, such patterns are referred to as actionable. Patterns that are
expected can be interesting if they confirm a hypothesis that the user wished
to validate.
The
second question—“Can a data mining system generate all of the
interesting patterns?”—refers to the completeness of a data mining
algorithm. It is often unrealistic and inefficient for data mining systems to
generate all of the possible patterns. Instead, user-provided constraints and
interestingness measures should be used to focus the search. Association rule
mining is an example where the use of constraints and interestingness measures
can ensure the completeness of mining.
Finally,
the third question—“Can a data
mining system generate only interesting patterns?”— is an optimization
problem in data mining. It is highly desirable for data mining systems to
generate only interesting patterns. This would be much more efficient for users
and data mining systems, because neither would have to search through the
patterns generated in order to identify the truly interesting ones.
6) Classification
of Data Mining Systems
Data mining is an interdisciplinary field, the confluence of a set of
disciplines, including database systems, statistics, machine learning,
visualization, and information science (as shown below Figure).
Because of
the diversity of disciplines contributing to data mining, data mining research
is expected to generate a large variety of data mining systems. Therefore, it
is necessary to provide a clear classification of data mining systems. Data
mining systems can be categorized according to various criteria, as follows:
Fig: Data mining
as a confluence of multiple disciplines.
i.
Classification according to the kinds
of databases mined: A data
mining system can
be classified
according to the kinds of databases mined. Database systems can be classified according
to different criteria, each of which may require its own data mining technique.
Data mining systems can therefore be classified accordingly.
For instance, if classifying according to data models, we may have a
relational, transactional, object-relational, or data warehouse mining system.
If classifying according to the special types of data handled, we may have a
spatial, time-series, text, stream data, multimedia data mining system, or a World
Wide Web mining system.
ii.
Classification according to the kinds
of knowledge mined: Data mining systems can
be categorized
according to the kinds of knowledge they mine, that is, based on data mining
functionalities, such as characterization, discrimination, association and correlation
analysis, classification, prediction, clustering, outlier analysis, and
evolution analysis.
iii.
Classification according to the kinds
of techniques utilized: Data mining systems can be categorized according to the underlying
data mining techniques employed. These techniques can be described according to
the degree of user interaction involved (e.g., autonomous systems, interactive
exploratory systems, query-driven systems) or the methods of data analysis
employed (e.g., database-oriented or data warehouse– oriented techniques,
machine learning, statistics, visualization, pattern recognition, neural
networks, and so on).
iv.
Classification according to the applications
adapted: Data mining
systems can also be categorized according to the applications they adapt. For
example, data mining systems may be tailored specifically for finance,
telecommunications, DNA, stock markets, e-mail, and so on. Different
applications often require the integration of application-specific methods.
7)
Data Mining Task Primitives
Each user will have a data mining task. A data mining task can be
specified in the form of a data mining query, which is input to the data mining
system. A data mining query is defined in terms of data mining task primitives.
The data mining primitives specify the following:
i.
The set of task-relevant data to
be mined: This specifies the
portions of the database
or the set
of data in which the user is interested. This includes the database attributes
or data warehouse dimensions of interest.
ii.
The kind of knowledge to be mined: This specifies the data
mining functions to be
performed,
such as characterization, discrimination, association or correlation analysis,
classification, prediction, clustering, outlier analysis, or evolution
analysis.
iii.
The
background
knowledge to
be used in the discovery process:
This knowledge about
the domain
to be mined is useful for guiding the knowledge discovery process and for
evaluating the patterns found. Concept hierarchies are a popular form of
background knowledge, which allow data to be mined at multiple levels of
abstraction.
iv.
The interestingness measures and
thresholds for pattern evaluation: They may be
used to guide the mining process or, after
discovery, to evaluate the discovered patterns. Different kinds of knowledge
may have different interestingness measures. For example, interestingness
measures for association rules include support and confidence.
v.
The expected representation for
visualizing the discovered patterns: This refers to the
Form in
which discovered patterns are to be displayed, which may include rules, tables,
charts, graphs, decision trees, and cubes.
Fig: Primitives
for specifying a data mining task.
A data mining query language can be designed to incorporate these
primitives. There are several proposals on data mining languages and standards.
We use a data mining query language known as DMQL (Data Mining Query Language),
which was designed as a teaching tool, based on the above primitives. The
language adopts an SQL-like syntax, so that it can easily be integrated with
the relational query language, SQL.
Example: Mining classification rules. Suppose, as
a marketing manager of AllElectronics, you would like to classify
customers based on their buying patterns. You are especially interested in
those customers whose salary is no less than $40,000, and who have bought more
than $1,000 worth of items, each of which is priced at no less than $100. In
particular, you are interested in the customer’s age, income, the types of
items purchased, the purchase location, and where the items were made. You
would like to view the resulting classification in the form of rules. This data
mining query is expressed in DMQL as follows,
(1) use database AllElectronics_db
(2) use hierarchy location_hierarchy for
T.branch, age_hierarchy for C.age
(3) mine classification as
promising_customers
(4) in relevance to C.age, C.income,
I.type, I.place_made, T.branch
(5) from customer C, item I, transaction T
(6)whereI.item_ID=T.item_ID
and C.cust_ID = T.cust_ID and C.income_40,000 and I.price>=100
(7) group by T.cust_ID
(8) having sum(I.price) >= 1,000
(9) display as rules
8)
Integration of a Data Mining System with a Database or Data Warehouse System:
A critical
question in the design of a data mining (DM) system is how to integrate or couple
the DM system with a database (DB) system and/or a data warehouse (DW) system.
If a DM system works as a stand-alone system or is embedded in an application program,
there are no DB or DW systems with which it has to communicate. This simple scheme
is called no coupling. Possible integration schemes include no
coupling, loose coupling, semitight coupling, and tight coupling.
·
No coupling: No coupling means that a DM
system will not utilize any function of a DB or DW system. It may fetch data
from a particular source (such as a file system), process data using some data
mining algorithms, and then store the mining results in another file. Drawbacks in such system are: 1) A DB
system provides a great deal of flexibility and efficiency at storing,
organizing, accessing, and processing data. Without using a DB/DW system, a DM system
may spend a substantial amount of time finding, collecting, cleaning, and
transforming data. 2) Without any coupling of such systems, a DM system will
need to use other tools to extract data, making it difficult to integrate such
a system into an information processing environment. Thus, no coupling
represents a poor design.
·
Loose coupling: Loose coupling means that a DM
system will use some facilities of a DB or DW system, fetching data from a data
repository managed by these systems, performing data mining, and then storing
the mining results either in a file or in a designated place in a database or
data warehouse. Loose coupling is better than no coupling because it can fetch
any portion of data stored in databases or data warehouses by using query
processing, indexing, and other system facilities.
·
Semitight coupling: Semitight coupling means that
besides linking a DM system to a DB/DW system, efficient implementations of a
few essential data mining primitives can be provided in the DB/DW system. These
primitives can include sorting, indexing, aggregation, histogram analysis,
multiway join, and precomputation of some essential statistical measures, such
as sum, count, max, min, standard deviation, and so on.
·
Tight coupling: Tight coupling means that a DM
system is smoothly integrated into the DB/DW system. The data mining subsystem
is treated as one functional component of an information system. Data mining
queries and functions are optimized based on mining query analysis, data
structures, indexing schemes, and query processing methods of a DB or DW
system. This approach is highly desirable because it facilitates efficient
implementations of data mining functions, high system performance, and an
integrated information processing environment.
9) Major Issues in Data Mining:
Major
issues in data mining are
·
Mining methodology and user interaction
issues: These reflect the
following:
i)Mining different kinds of knowledge in
databases: different
users can be interested in different kinds of knowledge, so data mining should
cover a wide spectrum of data analysis and knowledge discovery tasks, including
data characterization, discrimination, association and correlation analysis,
classification, prediction, clustering, outlier analysis, and evolution
analysis.
ii) Interactive mining of knowledge at
multiple levels of abstraction: For databases containing a huge amount of data, appropriate sampling
techniques can first be applied to facilitate interactive data exploration.
Specifically, knowledge should be mined by drilling down, rolling up, and
pivoting through the data space.
iii) Incorporation of background
knowledge: Background
knowledge, or information regarding the domain under study, may be used to
guide the discovery process and allow discovered patterns to be expressed in
concise terms and at different levels of abstraction.
iv) Data mining query languages and ad
hoc data mining: Relational
query languages (such as SQL) allow users to pose ad hoc queries for data
retrieval. In a similar vein, high-level data mining query languages need to be
developed to allow users to describe ad hoc data mining tasks for analysis, the
domain knowledge, the kinds of knowledge to be mined, and the conditions and
constraints to be enforced on the discovered patterns.
v) Presentation and visualization of
data mining results: Discovered
knowledge should be expressed in high-level languages, visual representations,
or other expressive forms so that the knowledge can be easily understood and
directly usable by humans. This requires the systemto adopt expressive
knowledge representation techniques, such as trees, tables, rules, graphs,
charts, crosstabs, matrices, or curves.
vi) Handling noisy or incomplete data: The data stored in a database may reflect noise, exceptional cases, or
incomplete data objects. As a result, the accuracy of the discovered patterns
can be poor. Data cleaning methods and data analysis methods that can handle
noise are required.
vii) Pattern evaluation—the
interestingness problem: A data mining
system can uncover thousands of patterns. Many of the patterns discovered may
be uninteresting to the given user, either because they represent common
knowledge or lack novelty.
·
Performance issues: These include efficiency, scalability,
and parallelization of data mining algorithms.
i) Efficiency and scalability of data
mining algorithms: To effectively extract information from a
huge amount of data in databases, data mining algorithms must be efficient and
scalable. In other words, the running time of a data mining algorithm must be
predictable and acceptable in large databases.
ii)Parallel, distributed, and incremental
mining algorithms: The huge size of many databases, the wide
distribution of data, and the computational complexity of some data mining
methods are factors motivating the development of parallel and distributed data
mining algorithms. Such algorithms divide the data into partitions, which are
processed in parallel. The results from the partitions are then merged. The
high cost of some data mining processes promotes the need for incremental data
mining algorithms that incorporate database updates without having to mine the
entire data again “from scratch.” Such algorithms perform knowledge
modification incrementally.
·
Issues relating to the diversity of
database types:
i) Handling of relational and complex
types of data: Because relational databases and data
warehouses are widely used, the development of efficient and effective data mining
systems for such data is important.
ii) Mining information from
heterogeneous databases and global information systems: Local- and wide-area computer networks
(such as the Internet) connect many sources of data, forming huge, distributed,
and heterogeneous databases. The discovery of knowledge from different sources
of structured, semi structured, or unstructured data with diverse data
semantics poses great challenges to data mining.